Tableau is a data visualization tool (software) to provide actionable insights, the result may be used for simple education/presentation or for BI (Business Intelligence) analytic report for BA (Business Analyst), stakeholders, etc.
This short article is a brief introduction ('Quick Start') of how to use Tableau, Tableau has many functions but only 3 main functions are covered in this article.
- Connect to data source (Tableau has many built-in libraries to connect and parse various data sources):
- Local FILE: MS Excel, Text file, JSON, PDF, etc.
- Remote server: Tableau server, MS SQL Server, Oracle, MySQL, Web Data Connector (WDC, to connect to custom API through http, this is quite important feature), etc.
- Define data types and value (from the data source): this is optional, tableau able to automatically parse and extract the data from excel columns, DB tables, etc.
- Tableau provide a way to create custom SQL query, tableau can not automatically parse everything we want so we can create new custom dataset from data source, eg: query join multiple tables, get aggregated values of sum(), avg(), etc. (see: https://onlinehelp.tableau.com/current/pro/desktop/en-us/calculations_calculatedfields_aggregate_create.htm)
- Visualize the data (show output): show graphic charts, eg: simple table, horizontal/vertical bar, pie chart, line chart, maps, etc.
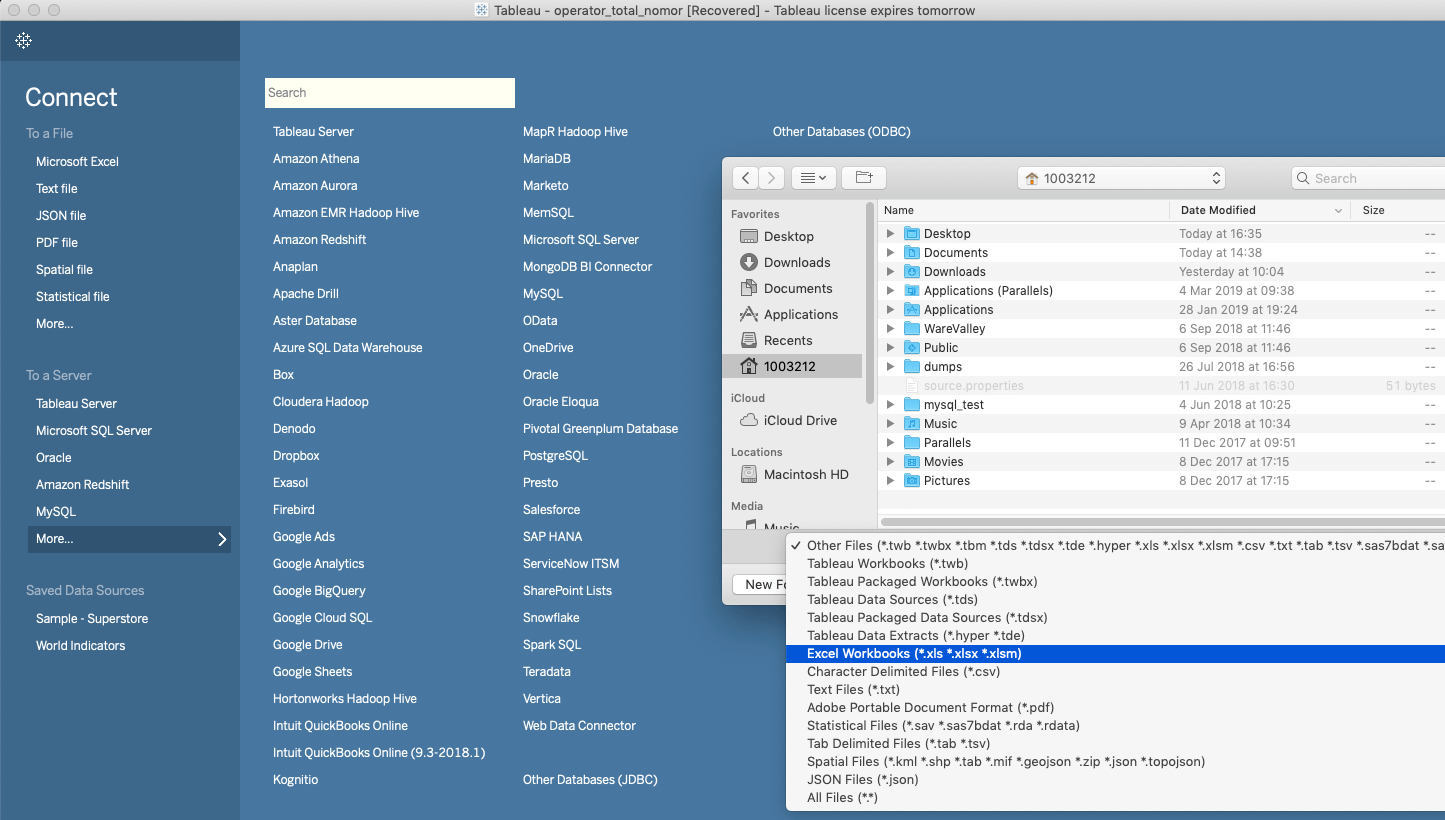
When we open Tableau then the first step is to connect to our data,
a screenshot example to connect data source, select 'Microsoft excel'
Sample excel file content, data title: Player Sport Points
| Date | Player name | Sport name | Point |
|---|---|---|---|
| 2019-03-01 | George | Swimming | 13 |
| 2019-03-02 | George | Bicycling | 9 |
| 2019-03-03 | George | Tennis | 17 |
| 2019-03-01 | Mike | Boxing | 18 |
| 2019-03-02 | Mike | Badminton | 19 |
| 2019-03-03 | Brandon | Running | 20 |
| 2019-03-05 | Brandon | Bicycling | 24 |
| 2019-03-04 | Harry | Archery | 8 |
| 2019-03-06 | Harry | Long Jump | 5 |
| 2019-03-05 | Sandy | Wrestling | 17 |
| 2019-03-04 | George | Tennis | 24 |
| 2019-03-05 | George | Tennis | 31 |
| 2019-03-05 | Harry | Swimming | 10 |
| 2019-03-06 | Harry | Swimming | 14 |
With the above simple data, we don't need to define custom data type or aggregated value because Tableau is smart enough to parse all columns and values automatically.
To visualize the data, we need to define our data into 2 categories:
- Dimension: qualitative value, something that can not be measured/calculated, such as: person name, color, taste, etc., normally Dimension is used to define LABEL or COLOR in chart.
- Measure: quatitative value, something that can be aggregated or calculated, such as: score, point, age, length, etc.
Some example charts output
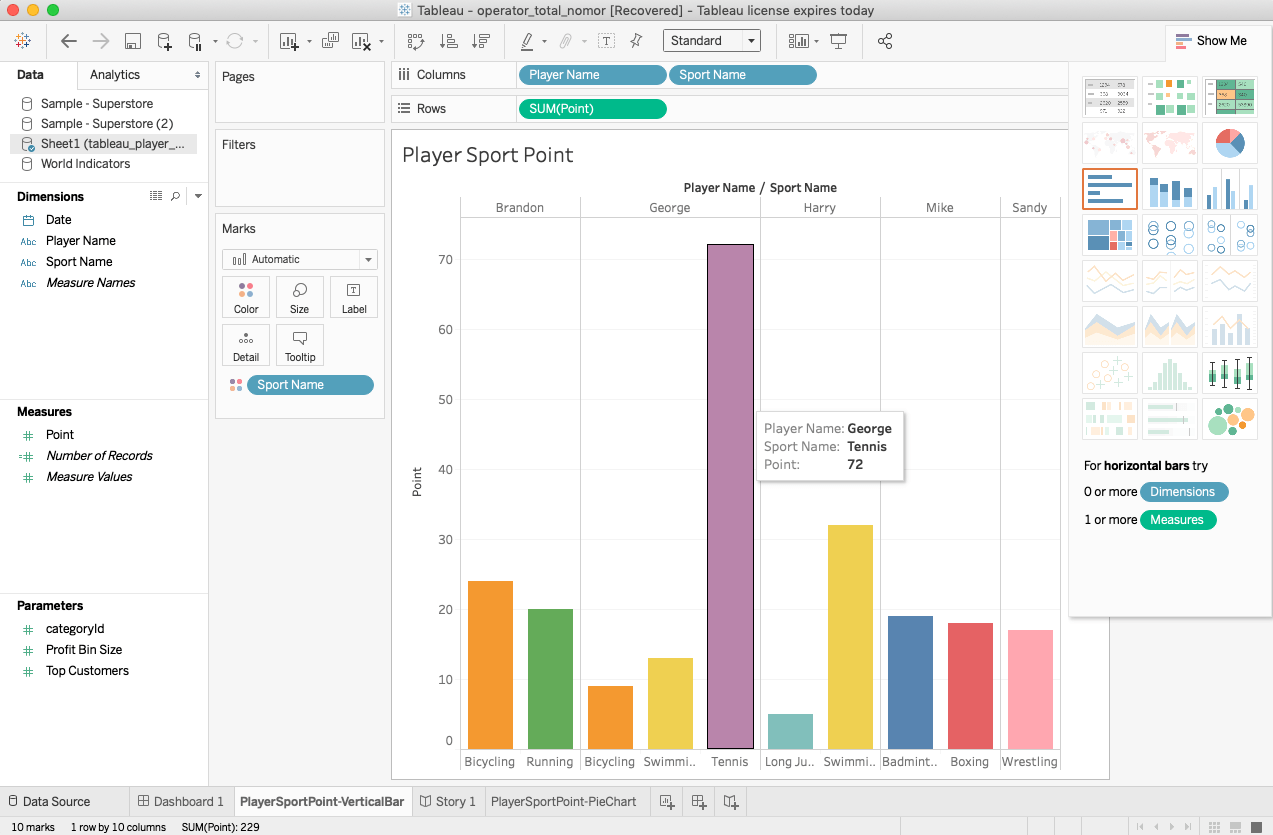
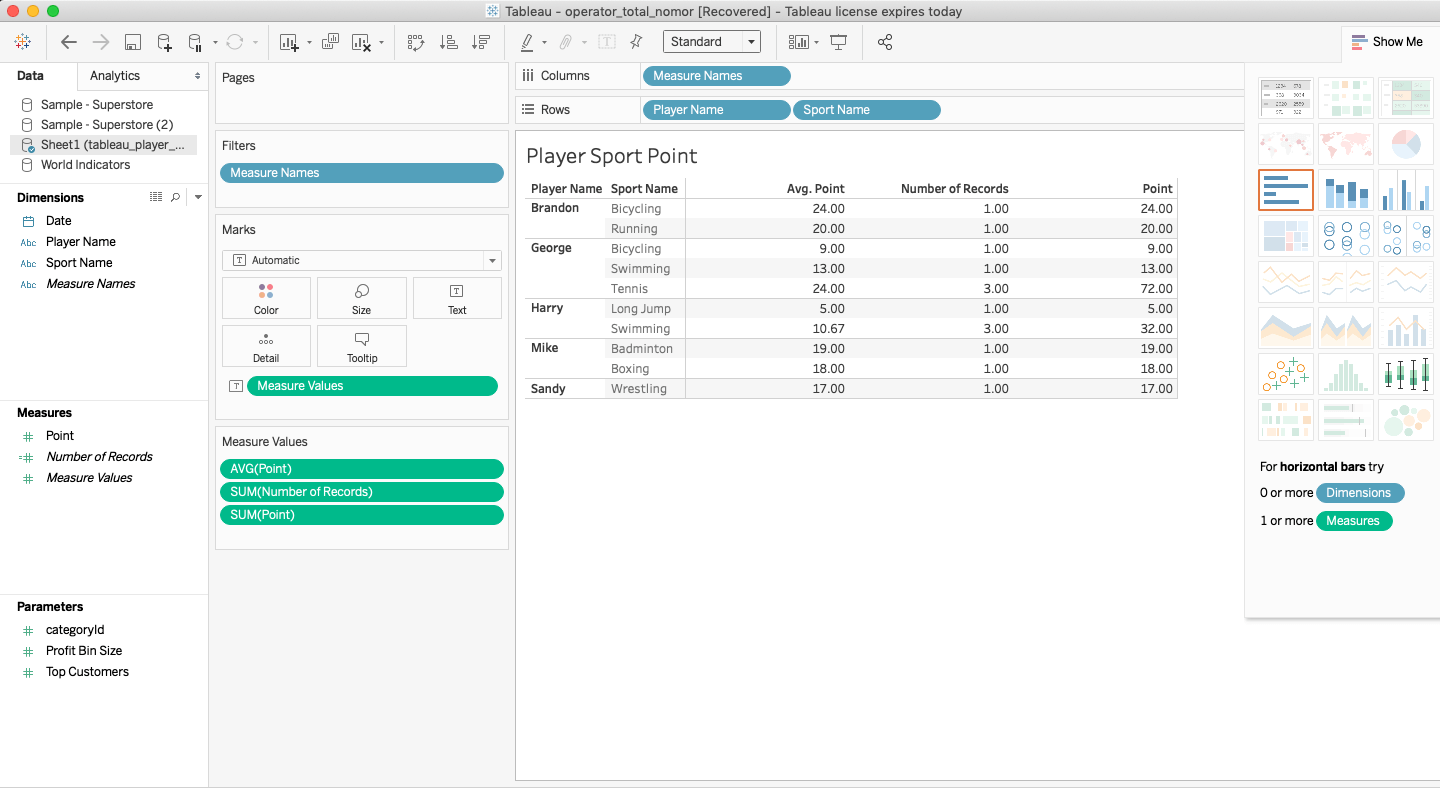
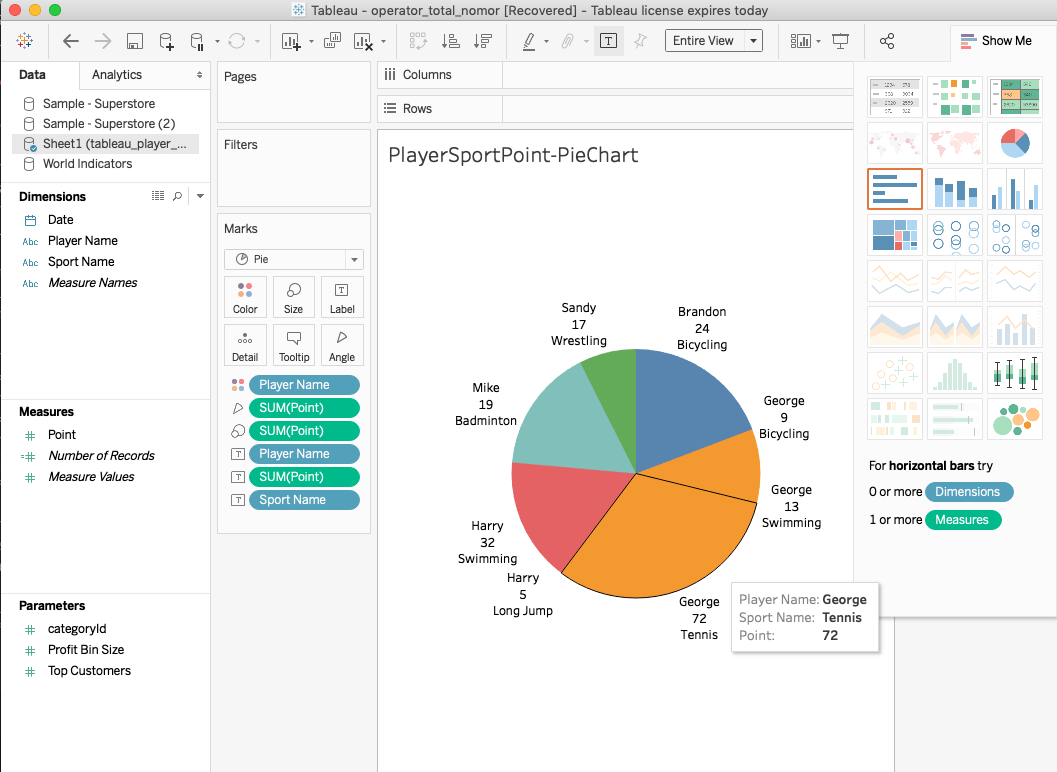
Tableau has reactive chart UI which can use mouse to see chart movements, below is JavaScript code to show 'similar' reactive Pie chart, please use mouse to hover any slice of the pie to highlight it.
Tableau also can create a presentation (slides) to tell story (storytelling) with the data, storytelling is very important to create a success presentation, it brings data to life and this is allowing the viewer to make personal connection to the information, for more information about 'story-telling' please follow this link Tableau - story telling
Tableau is useful to quickly visualize data, by only knowing these 3 main functions then anytime there is a sudden need during meeting to show data chart from current active remote database then we can open Tableau to connect to the remote database and show the chart to others. Hope this brief presentation can provide understanding of how easy to use Tableau and how powerful it is.